
When it comes to presenting data in a user-friendly and comprehensible manner, there is no easy way rather than using a data visualization plugin.
Yes, we are talking about tables, charts, graphs, infographics, and you name it.
There are a handful number of data visualization WordPress plugins available. These plugins can make your data easy to understand and engaging.
If you’re looking for a great data visualization plugin, you’re in the right place. Here’s a list of our favorites.
Plugin | Types | Ratings | More Info |
Visualizer | Tables & Charts | ||
WP Table Builder | Tables | ||
Ultimate Blocks | Progress Bar, Counter, Timeline | ||
Tableberg | Tables | ||
wpDataTables | Tables & Charts | ||
M Chart | Charts | ||
Data Table Generator | Tables & Charts | ||
Ninja Charts | Charts & Graphs |
Now let’s dive into the details of these plugins.
Visualizer
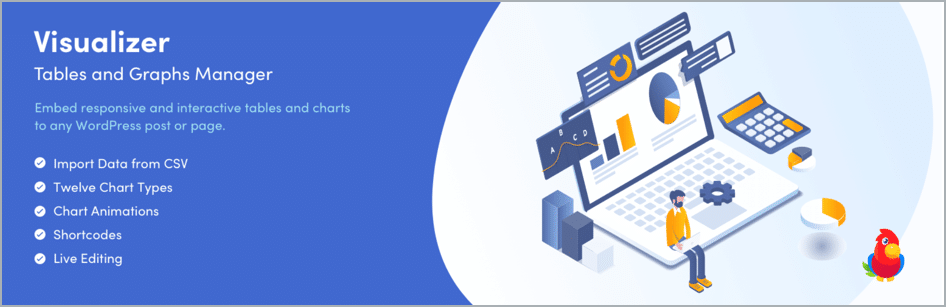
Visualizer is a prominent table and chart manager. With around 15 chart types, this plugin helps you visualize your data in an epic manner, thus living up to its name.
Visualizer helps modify your tables like any Excel file, along with providing added functionalities. Select your preferred chart, import data from your sources (such as Excel, CSV, and Google Sheets) and that’s it. Your charts will be editable in real-time and customizable according to colors, design, and behavior. The charts are also supported by Gutenberg – which is definitely an added bonus.
Here’s a fun feature! The plugin lets you analyze and create charts based on your past WordPress activities, such as the number of posts, pages, or attachments you’ve shared so far. No matter what device your users are on (iPhones, iPads, Android, or PC), the charts are responsive. Visualizer comes with an incredible support team, ready to answer all your queries. Add, clone, edit, and delete charts to your hearts’ desire with Visualizer!
WP Table Builder
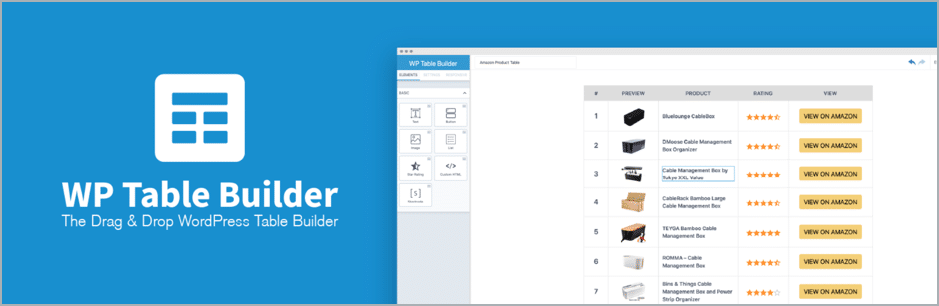
If you’re a fan of the “Drag and Drop” plugin (as we all WordPress users are), then WP Table Builder is for you. It’s a fantastic plugin to create responsive, elegant, and beautiful tables within a few clicks. It lets you build custom and intuitive tables that require zero coding. It also comes with a large number of pre-built templates, perfect to edit whenever you require. And yes, you can set your own template tables too for future uses.
The plugin seamlessly integrates with the Gutenberg editor and lets you build and edit tables without leaving the editor. It comes with 12 elements: Text, Image, List, Button, Star Rating, Custom HTML, Shortcode, Circle Rating, Icon, Ribbon, Styled List, and Text + Icon. You can import tables from CSV or XML files and export your created tables too.
Also Read: The 8 Best WordPress Table Plugins
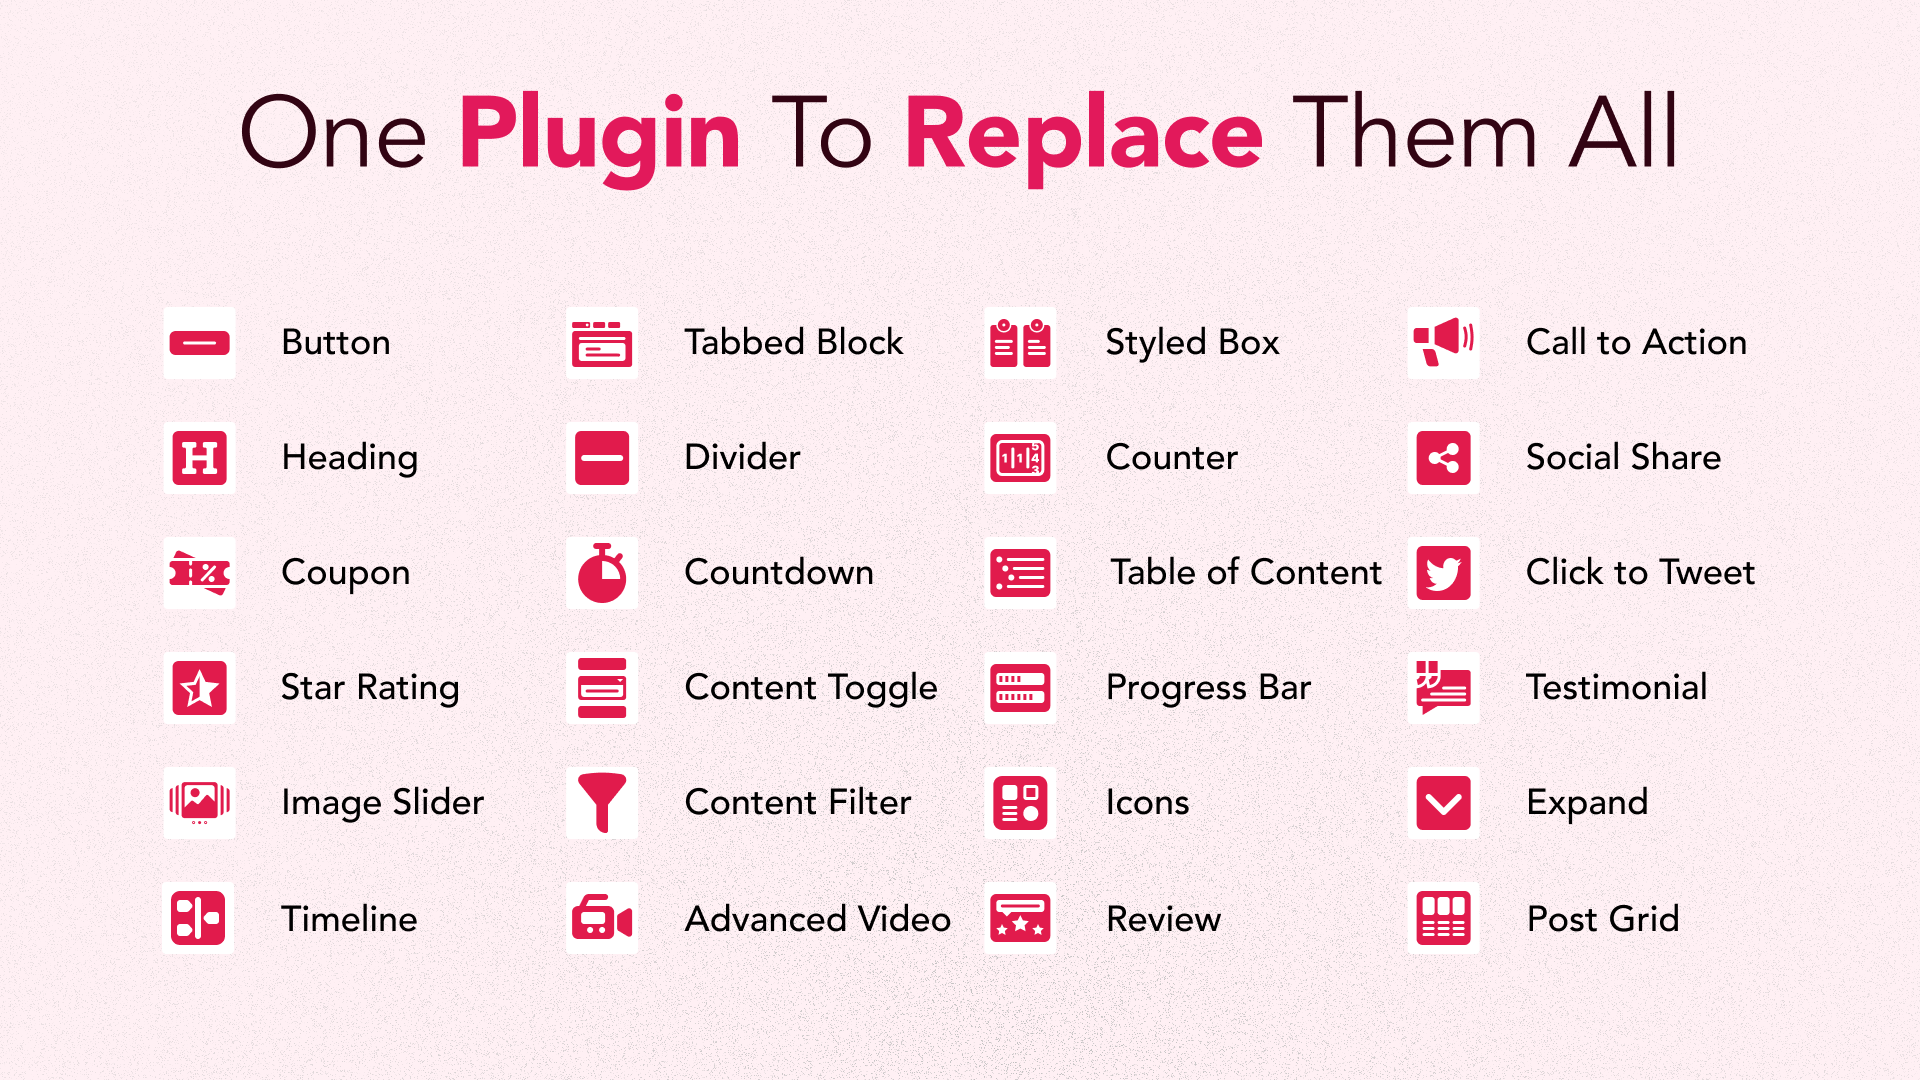
Ultimate Blocks
Ultimate Blocks is a powerful blocks plugin that adds 20+ custom Gutenberg blocks to the WordPress Block Editor. These blocks are designed to improve the functionality of the editor and make it easier to create engaging and better content.
One of the blocks is Progress Bar, which can be used to display progress data in a visually appealing way. You can use it to show progress of a project, a goal, a fundraising campaign, or any other metric. The block comes with easy customizations and lets you match the look and feel of your site.
It has another block called Counter Block that lets you showcase different stats in animated numbers. Here’s an example .
The plugin has another block called Timeline block that lets you showcase historical data in timelines. Here’s an example of the timeline block.
1976
Apple Inc
Apple Computer, Inc. was founded on April 1, 1976, by Steve Jobs and Steve Wozniak.
1977
The Apple II
Apple introduced the Apple II, the first mass-produced Apple computer.
1980
Macintosh
Apple introduced the Macintosh, the first personal computer that got commercial success.
1990
Apple IPO
Apple went public offering 4.6 million shares at $22 per share.
Additionally, the plugin offers some useful blocks like tabbed content, content toggle, call to action, review box, content filter, countdown timer, image slider, and more.
Tableberg
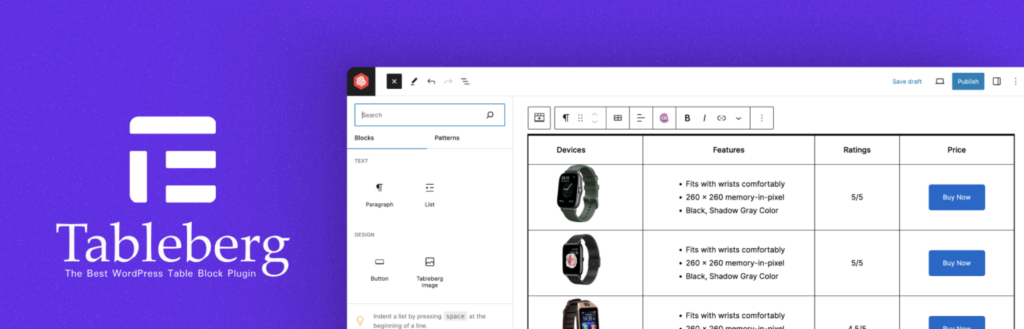
Tableberg is an intuitive WordPress plugin tailored for users looking to integrate tables into their WordPress websites seamlessly. Designed to focus on ease of use, Tableberg allows users to create and manage tables effortlessly through its user-friendly interface.
Tableberg’s customization options are not just robust, they’re empowering. You can adjust colors, fonts, and borders to your heart’s content, ensuring your tables seamlessly blend with your website’s overall aesthetic. This versatility makes Tableberg a go-to for bloggers, marketers, and businesses, enabling them to enhance their data presentation without the need for extensive technical knowledge.
Tableberg simplifies the table creation process and enhances functionality, allowing for effective data management and presentation on WordPress sites.
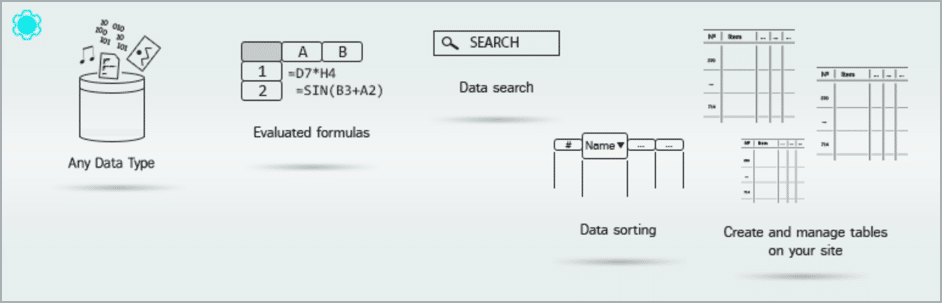
wpDataTables
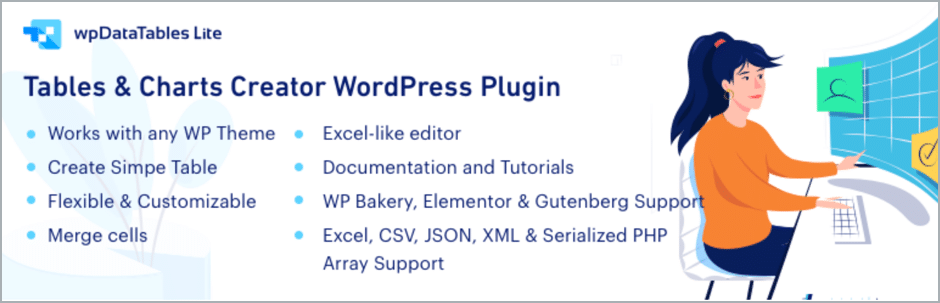
Looking for a cool data management tool? Look no further!
wpDataTables lets you create both tables and charts. The tables and charts are easily accessible from any device, as they are natively responsive. You can easily search and find any information on your tables too, and these operations are maintained by an SQL server. The tables are highly editable and customizable, giving you a smooth experience.
The tables can easily be converted into charts of your choosing. A few of the many examples available here are Line charts, Column charts, Pie charts, Area charts, Stepped Area charts, histograms, Bar charts, Stacked Bar charts, Bubble charts, Donut charts, and more. You can configure color and fonts according to your preferences too!
The plugin has both a basic and premium version. It’s a great tool to handle, calculate and manage large amounts of data.
M Chart

Transform your scattered data points into charts using M Chart. It uses Chart.js to create charts, which you can later share as posts whenever you want to.
The plugin doesn’t come with many styling options, rather it is quite simple and straightforward. In order to add styling options, it requires basic CSS from the user’s end. With M Chart, you can create a wide variety of charts such as Line charts, Bar charts, Pie charts, and Column charts.
It also comes with a spreadsheet editor, enabling you to manage, arrange and work on your data using a spreadsheet interface.
Data Table Generator
As the title suggests, this plugin helps generate responsive data tables. It supports figures, charts, and graphs too. Search, sort, import, and export data as much as required with Data Table Generator.
Data Table Generator is an all-in-one package of flexible and customizable data management tools. Its tables can be modified according to your preferences and customized visually to meet the criteria of your WordPress site. As it is quick and user-friendly, it gets the job done in a short amount of time.
A unique feature is that Data Table Generator comes with a Pagination feature. This lets you optimize your content as well as make it compact. Pagination transforms your content into bite-sized pieces with the necessary Call to Action buttons, ensuring that viewers have an effective experience. Users on your site can easily use this feature to skim through the site to find their required information.
It also supports WooCommerce, enabling you to set data tables according to your product list. As it is responsive, it makes your site adjustable to every device. Its sorting tool allows customers to view and sort your products as they desire. Even if you have over a hundred products, Data Table Generator works like a charm in adding SKU, Buy, Summary, Date, Price, Thumbnail, Reviews, and more!
Ninja Charts

Ninja Charts is a plugin that harnesses the power of JavaScript to build you fabulous charts and graphs. It is quick, lightweight, and editable online.
It supports 9 chart types including Line charts, Pie charts, Bar charts, Bubble charts, Doughnut charts, Radar charts, Polar charts, and more. Ninja Charts is hooked with another plugin from the same developers, Ninja Tables. Users can use both plugins together to create charts from tables. With Ninja Charts, you have the option to place data manually or retrieve it directly from Ninja Tables, and voilà! The charts will be generated instantly.
Here, you can customize every aspect of your charts including Chart width, Responsive chart width, Chart height, Background color, Font size, Font style, and more.
The interface is drag-and-drop friendly, along with a responsive platform. Its support team is phenomenal, ready to cater to your every need.
Conclusion
We’ve already mentioned this, and we’ll say it again. Data visualization plugins are a must-have for any data you’re willing to share. They are practical, straightforward, easy to grasp, and most importantly- immensely fun to create. Give them a try and your audience will thank you!
Leave a Reply